David's Top Producer Sales TOP PRODUCER SALES . COM
For More Info or to Order by Phone
CALL 1-888-666-4643


MARKET SNAPSHOT


Consumers want accurate information and a personalized experience when beginning their real estate buying and selling process online. Market Snapshot will help agents cultivate active leads by providing the most current Multiple Listing Service® market information.

The Market Snapshot service sends consumers a link to Market Snapshot within 30 minutes from the time the consumer requests market information. The consumer can then control how often they want to receive updated Market Snapshot information.

Creating trusting relationships with consumers is critical to successful marketing online. Market Snapshot provides a valuable way to automatically provide responsive, personal service throughout the buying and selling process.


The Market Snapshot provides valuable and timely data which addresses at-a-glance additional questions that consumers may have. This ability to trigger additional questions and concerns helps to shape a valuable dialogue with the sponsored agent and the inquiring consumer. This positions the agent as the interpreter rather than the simple provider of data which helps facilitate the first telephone contact.

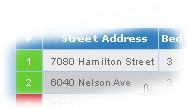
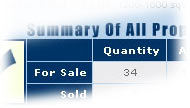
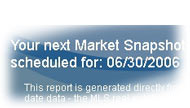
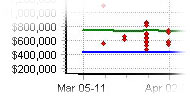
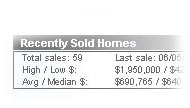
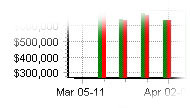
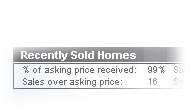
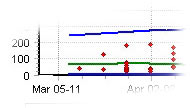
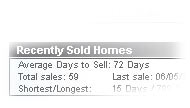
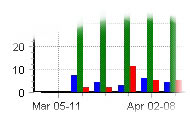
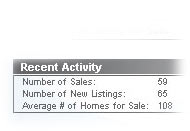
Review each section of the Market Snapshot below to experience the real-time content produced from the local MLS. Top Marketer produces the Snapshot so there is no effort on the agent's behalf required to continually create the report. This is the type of information that will help you to persistently cultivate strong relationships with your consumers.

Now available through Top Producer 7i. You can now use your Top Producer 7i to designate clients or prospects to have the Market Snapshot automatically created and delivered.


Market Snapshot from Top Producer for Realtors
For more information on a certain area, move the mouse pointer over the circles. Prices Page Selling Times Page
View Live Demo
  • Prices Page

    Uses graphs and tables to compare listing and sold prices in the requesting area.

  • Selling Times Page

    Uses graphs and tables to illustrate how long it is taking to sell properties comparable to the consumer's search parameters.

  • 1

    1. Intro

    Personalized to the consumer, this quick note includes the date the report was generated and lets the consumer know the information comes from the MLS.

    intro
  • 2

    2. Road/Aerial/Hybrid

    The consumer can choose to view the map as an illustration featuring roads or as a satellite picture. There is even an option to view a hybrid of both.

    Road/Aerial/Hybrid
  • 3

    3. Listings Pop-Up Bubble

    If the consumer selects one of properties either by selecting it from the list or selecting it on the map, a bubble appears with more details of the property. The listing details contain most of the general information on the property as stored with the MLS such as the property features and a picture, if available.

    Listings Pop-Up Bubble
  • 4

    4. Map

    The map displays up to 10 of the active or sold comparable properties in the area of the consumer's interested home and can be zoomed or panned as desired. The consumer can select any listing to obtain further property information.

    map
  • 5

    5. List of Properties

    Below the map is a list of the properties giving basic information about the property. The consumer can select any listing to obtain further property information.

    List of Properties
  • 6

    6. Summaries

    Each page has its own summary. The Prices page summarizes the number of comparable properties for sale and sold in the area, as well as the average listing and sold price. The Selling Times page summarizes the number of comparable properties for sale and sold in the area, as well as the average number of days on market for the sold and the currently listed properties.

    Summaries
  • 7

    7. Interpretation

    At the bottom of the page are two more places where the consumer can contact the agent if more information is wanted or needed.

    Interpretation
  • 8

    8. Agent's Branding

    The agent branded portion includes the agent's picture, logo and contact information. If available, links are also provided to send the agent email as well as visit the agent's website.

    Agent's Branding
  • 9

    9. Next update

    This section tells the consumer when he or she can expect the next update. The consumer can change the frequency by editing the settings.

    Next Update
  • 10

    10. About This Report

    Link pops up a window containing answers to frequently asked questions about the Market Snapshot such as where does the data come from and how to interpret all the maps, graphs and data. There also is a glossary to help explain any terms in the Market Snapshot.

    About This Report
  • 11

    11. Price Graph

    The first graph compares asking (listing) prices and sold prices and highlights the high, low and average listing prices for comparable properties in the area. The graphs also include additional information such as dates sold and listed.

    Price Graph
  • 12

    12. Prices Table

    The tables summarize the data used for the graphs. The first table compares the recently sold homes with the currently active homes for high, low, average and median prices, as well as the number of homes sold and the number still on the market.

    Prices Table
  • 13

    13. Price Chart

    The second graph also compares asking (listing) prices and sold prices for all the comparable properties in the area. The green bars show the average asking price for a property that sold in that time period while the red shows the average sold price.

    Price Chart
  • 14

    14. Prices Table

    The tables summarize the data used for the graphs. The second table shows the number of sold homes that sold above, below or at the listing price. Properties consistently selling at above the asking price show a seller's market, while below the asking price show a buyer's market.

    Prices Table
  • 15

    15. Selling Times Graphs

    The first graph compares the time on Market for active (listing) and sold comparable properties. The green line is the average and can show whether the trend is for longer or shorter times on market. The blue lines are the high and low days on market. The red dots are when properties sold and how long it took to sell them. If a sold property is selected on the map, a pin will show on the graph to show when it sold and how long it took to sell.

    Selling Time Graphs
  • 16

    16. Selling Times Table

    The tables describe the data in the graphs in more general terms. The first table compares the recently sold properties with those still active; it compares the average days on market, the number of properties, the shortest and longest days on market and when the last sale occurred and the last new listing came on market.

    Selling Times Table
  • 17

    17. Selling Times Charts

    The second selling times chart shows the number of home for sale, sold or newly listed for the time period shown. The green bars are all the homes for sale at that time, the blue bars are the new listings and the red bars are for sold properties. If a sold property is selected on the map, a pin will show on the graph to show when it sold.

    Selling Time Charts
  • 18

    18. Selling Times Table

    The second table shows the recent activity in the area. It compares the number of sales and new listings in the area with the average number of homes for sale. If the number of sales is greater than the number of new listings, it may be a seller's market. If it is less, then a buyer's market.

    Selling Times Table
See how easy it is to generate Market Snapshot from Top Producer 7i


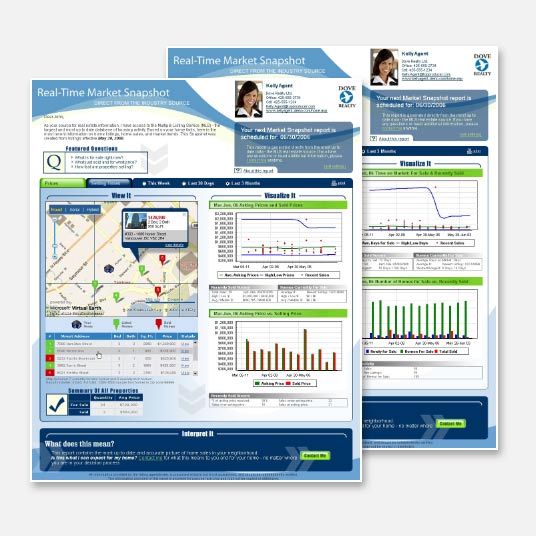
Track your Leads in Top Producer 7i
Leverage the industry's most successful sales and marketing solution, Top Producer 7i, in combination with Top Marketer to take full advantage of the majority of consumers that begin the home buying and selling process online.Consumer information is seamlessly captured in Top Producer 7i so you can quickly respond with personalized community and school reports, and easily create an automated follow up Action Plan.

Learn More
Branded for You Your brand remains 'front and center' throughout all communications to consumers. This service helps develop relationships with the consumers as they conduct their lengthy research, ensuring that the agent is both visible and well-considered when they make their important decision to choose a specific agent.

Learn More with Live Support and Coaching
Our Market Snapshot consultants are highly trained professionals ready to provide you with real time strategies to cultivate leads, take full advantage of the marketing tools our service provides, and help you get more listings today. One-on-one coaching is provided to help you maximize the value of Market Snapshot within your marketing area.

| | | | | | |

| | | | |

David Moninger
Authorized TOP PRODUCER SYSTEMS Value Added Reseller
55 Harbor View Lane, Suite 302
Belleair Bluffs, FL 33770
Toll Free: 1-888-666-4643   •   Home/Office: 727-587-0600
©1996 to 2007 All Rights Reserved
11/19/07